Main features of the UMG 605-PRO
The power quality analyzer, in accordance with EN 50160, is particularly suitable for DIN rail mounting. It is used to monitor the power quality in accordance with common standards, e.g. EN 6100024. The UMG 605-PRO is suitable for recording short and long-term flicker as well as for Profibus DP and Profibus DP V0. The UMG has two digital inputs and outputs and an additional temperature measurement input.
HARMONICS
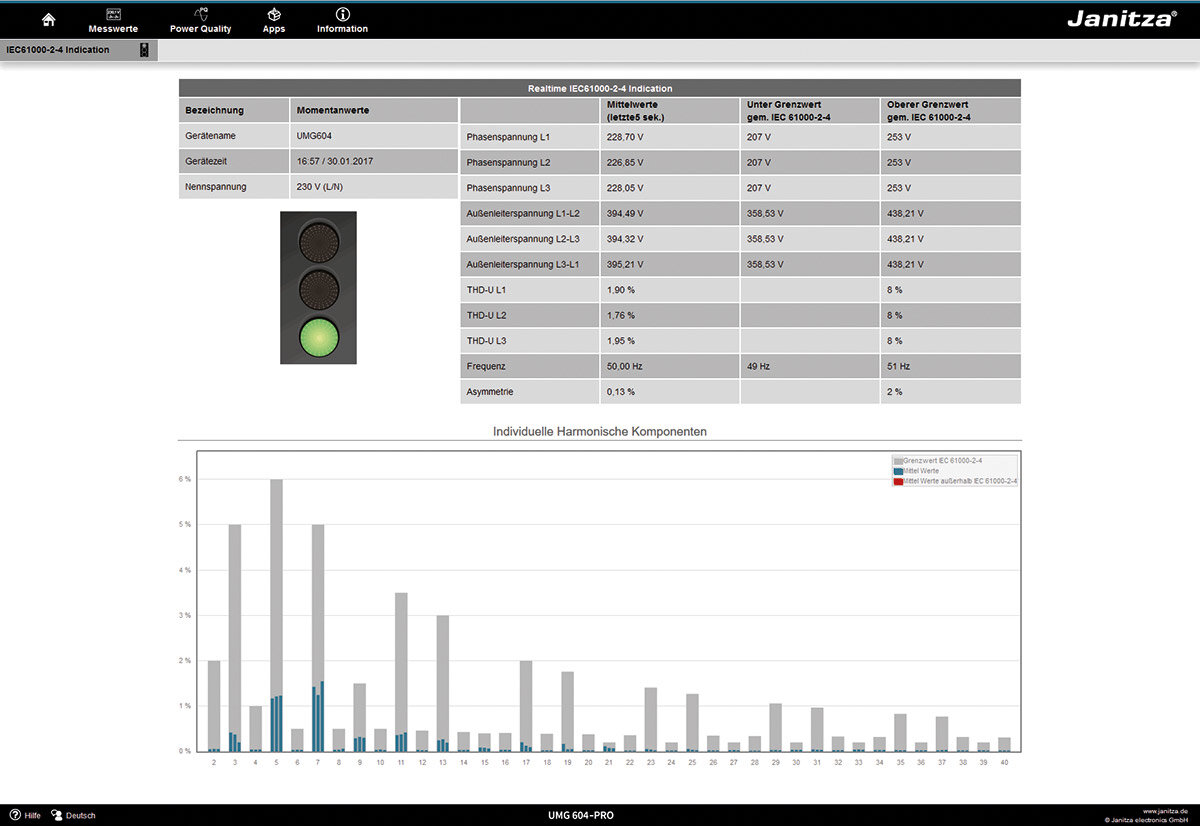
Harmonics are caused by equipment with non-linear characteristics, such as transformers operated in saturation, energy-saving lamps, frequency converters and power electronics. They burden the grid with additional currents and can affect or even destroy equipment. These grid perturbations can be detected and documented using power quality analyzers.
ALARM MANAGEMENT
REPORTING
FLICKER
MEMORY
Many UMG measurement devices have their own memory with typical recording ranges of up to 2 years. Recording is freely configurable. A 128 MByte memory can store around 5,000,000 memory values, a 256 MByte memory can store around 10,000,000 memory values.
Areas of application
- Power quality monitoring
- Ethernet gateway for subordinate measuring points
- Analysis of electrical disturbance variables for grid problems
- Report generator for various power quality standards
- Control tasks, e.g. depending on measured or limit values reached
- Transducer for building management system or PLC
VOLTAGE QUALITY
- Harmonic analysis up to the 40th harmonic
- Unbalance Distortion factor THD-U / THD-I
- Measurement of positive, negative and zero sequence
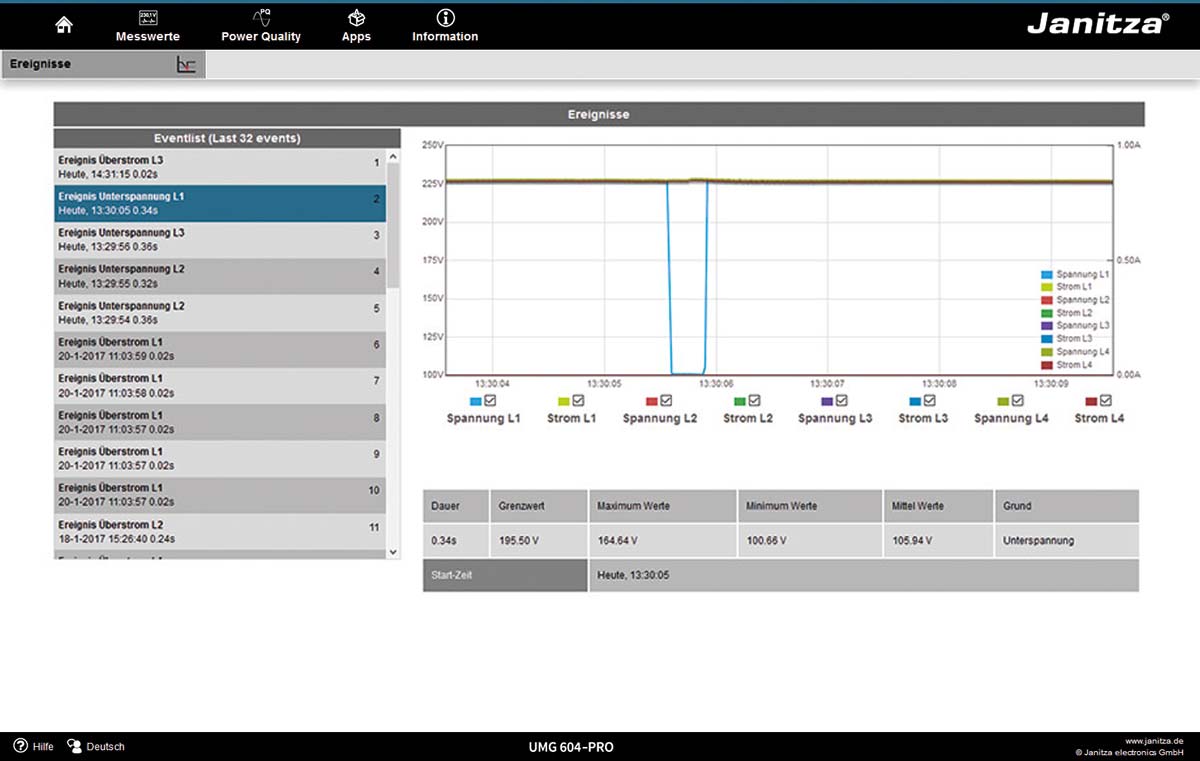
- Short interruptions (from 20 ms)
- Recording and storage of transients (> 50 μs)
- Start-up processes
- Fault recorder function
- Rotary field display
PERFORMANCE
- 4 voltage and 4 current measurement inputs
- Acquisition and digitization of RMS values (true RMS) of currents and voltages (15 – 440 Hz)
- Continuous sampling of the voltage and current measurement inputs at 20 kHz
- Recording of more than 2,000 measured values per measurement cycle (200 ms)
- For measuring current events
- Setting of a rated current possible
- The fourth current measurement input is suitable for measuring the current in the neutral or PE conductor or for measuring any potential difference between N and PE
- Large measured data memory (memory capacity = 5,000,000 measured values)
- Simple remote measurement data retrieval via the device’s own homepage
- All interfaces can be used simultaneously
CONVINCING REPORTING WITH GRIDVIS®
- Automatic generation and dispatch of power quality reports
- Power quality reports in accordance with EN 50160, EN 61000-2-4, IEEE519
- Illustration of the ITI (CBEMA) curve
- Freely definable scheduling for report generation
MODERN COMMUNICATION ARCHITECTURE VIA ETHERNET
- Fast, cost-optimized and reliable communication thanks to the connection to an existing Ethernet architecture
- Integration in PLC systems and BMS
- High flexibility through the use of open standards
- Simultaneous query of the interfaces possible
HIGHSPEED MODBUS
- Fast and reliable data transmission via RS485 interface
- Speed up to 921.6 kB/s
GRAPHIC PROGRAMMING
- Extensive programming options on the device, 7 programs simultaneously (PLC functionality)
- Jasic® source code programming
- Functional enhancements far beyond pure measurement
- Ready-made APPs from the Janitza library
CONVENIENT HOMEPAGE AND E-MAIL FUNCTIONS
- Information conveniently available by e-mail and via the device homepage
- Access to the powerful device homepage via web browser
- Online data, historical data, graphs of events and much more available directly from the homepage
LARGE MEASUREMENT DATA MEMORY
- 128 MByte
- 5,000,000 Memory values
- Recording range up to 2 years
- Recording freely configurable
Device website
THE EVALUATION AVAILABLE AT ANY TIME
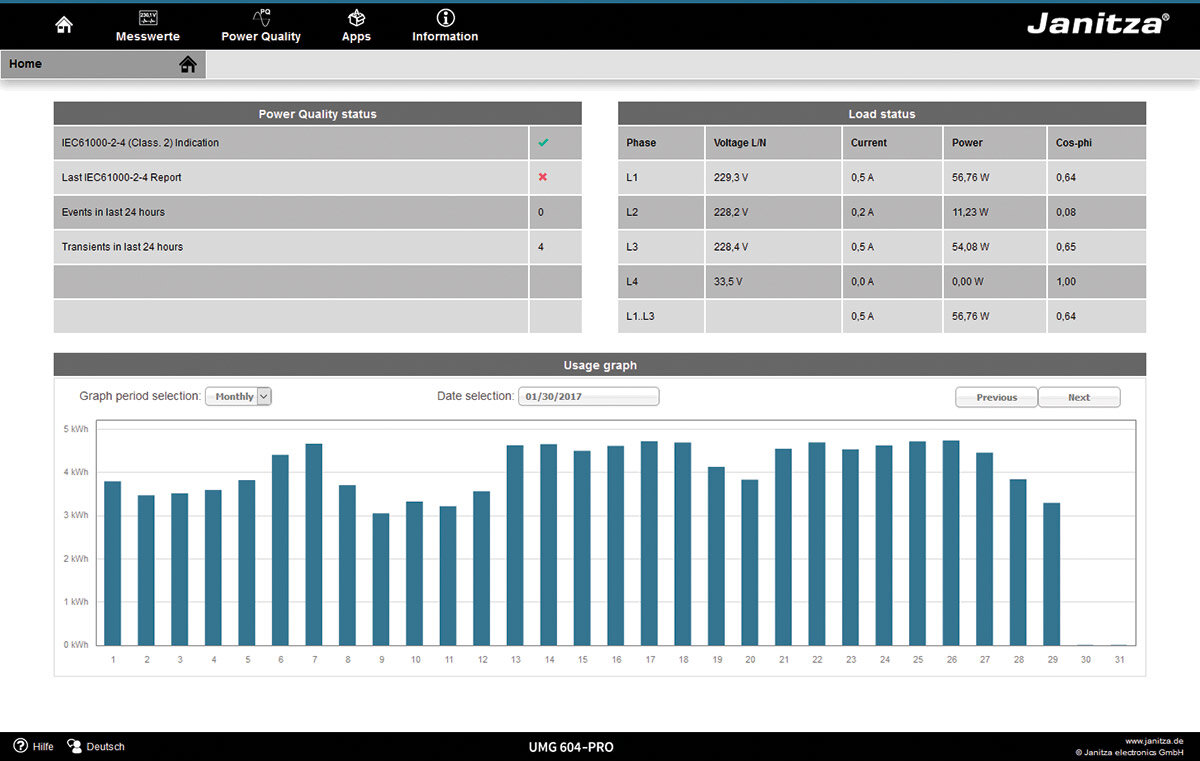
Each measuring device has an integrated web server with its own homepage. The measuring device can be operated via the device’s own homepage as well as via the device display.
In addition, current and historical measurement data, including power quality parameters, can be called up on a large scale. The advantage of the device homepage is the constant availability of measurement data – without prior software installation.
The user immediately receives an overview of all energy data. The device homepage can be displayed on any end device and is adapted according to the device functions (responsive design).
The uniform design of the GridVis® visualization software and the device homepage makes it easy to use.
YOUR BENEFITS
- Access to the powerful device homepage via web browser
- Constant availability of measurement data
- No software installation necessary
- Online data, historical data and much more can be called up directly via the device homepage
- Functional expansion through APPs possible
- Remote control of the device display via the homepage
- Integrated PQ watchdogs
- Hyperlinks provide more detailed information
- Integrated measured value monitor
- Overview of events and transients in the network
- Convenient selection of the calculation mode for displaying measurement data in accordance with the IEC 61000-2-4 or EN 50160 standard (applies to the UMG 605-PRO and UMG 512-PRO)


